Steps in making a geologic map on a satellite image base map
Consider this satellite image of an area on the eastern flank of Mount Cleveland volcano, near where it connects across an isthmus to the rest of Chuginadak Island. Study this image and you will begin to pick out specific geologic features, mostly based on changes in color and texture.
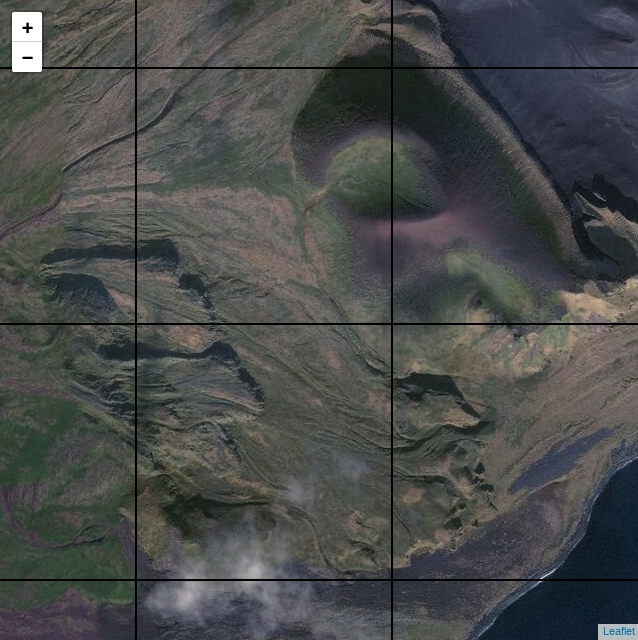
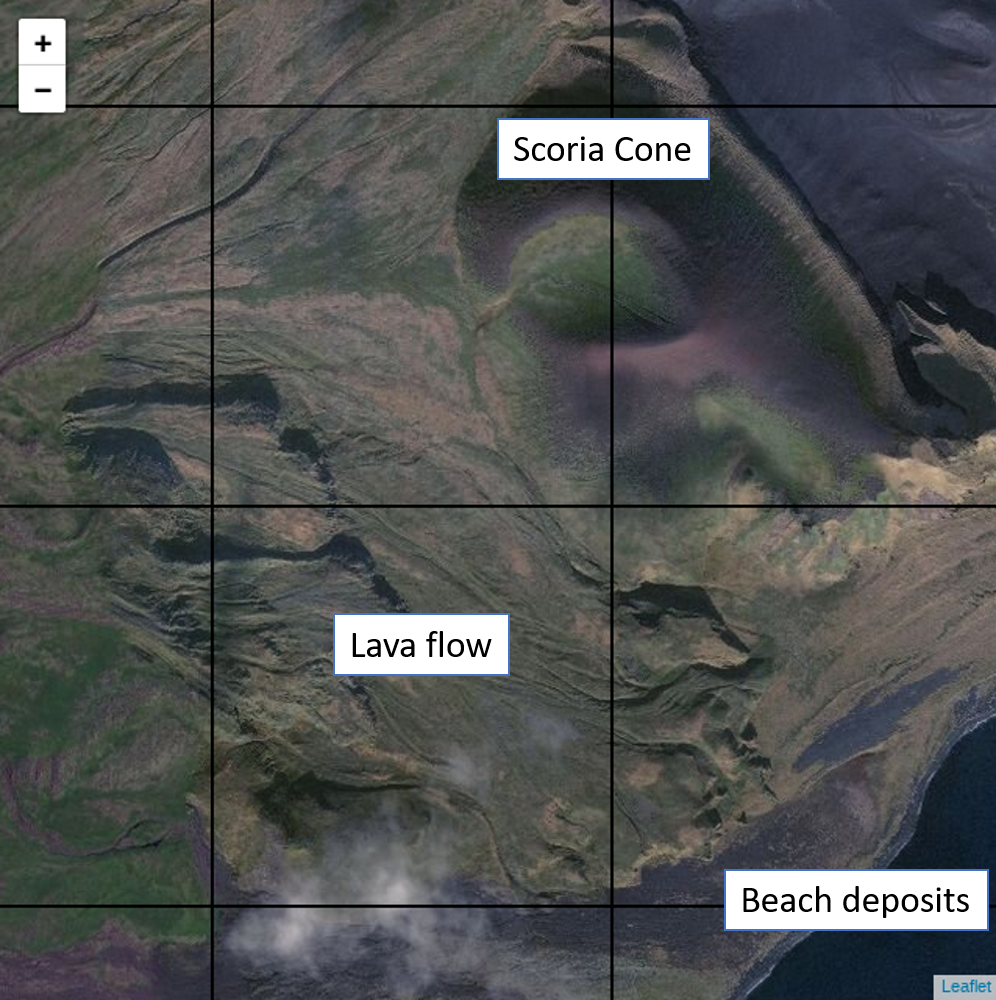
It takes practice to identify specific volcanic units on satellite images. In the following image, a lava flow is labeled. Notice the texture of the lava flow. This flow is elevated compared to surrounding topography. The surface is lobate (these are literally individual pulses of lava effused from a vent that have frozen in place). Long ridges (lava flow levees) occur parallel to the direction of the lava flow. These levees show how the flow channelized as it flowed downhill. Notice in this case the lava flow is not a dramatically different color on the satellite image than the surrounding terrain. Like the surrounding terrain the lava flow is sparsely vegetated. Sometimes relatively young lava flows stand out because of their dark color, especially when they are not vegetated.
The smooth circular feature NE of the lava flow is an explosive volcanic vent - a scoria cone. It is characterized on the satellite image by its dark gray to brown color, the presence of a crater, and its more or less circular form. Scoria cones are often oxidized to a red color (look at the south rim of this cone). Scoria cones often have very many small gullies because they are so easily eroded. This cone has many small gullies on its NE flank. Although we cannot visit this cone, we can infer from the textures we see on satellite image that this cone consists of relatively loose tephra particles. The crater of this particular scoria cone is very large compared to the volume of the cone. This is characteristic of a particularly violent eruption, perhaps resulting from interaction of magma and surface water during the eruption.
At the toe of the lava flow and the base of the scoria cone on its seaward side there is a flat area with reworked sediments. These are beach deposits.
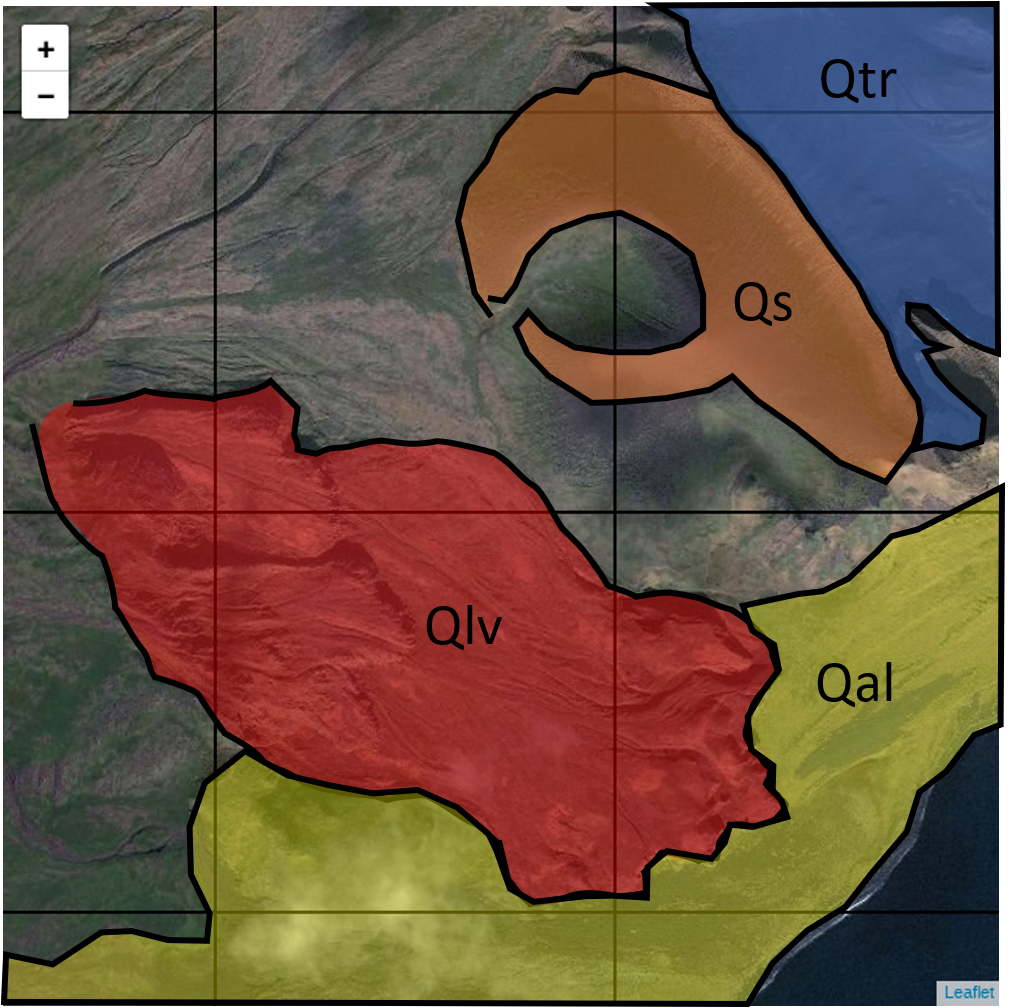
Next draw the geologic contact for the scoria cone. As with the lava flow, the contact is not always clear. In this case, it appears (!) that the crater floor is light colored and may show the underlying older rock. We are not exactly sure, but we interpret the image that way. Another interpretation that is reasonable from the satellite image is that the floor of the crater is covered with the same scoria found on the cone. Likewise, the beach deposit is outlined. The contact between the beach deposit and surrounding rocks is not always clear - especially in the cloudy area of the image - but is inferred from the satellite image as best we can.
Notice the NE corner of the map. This area is a black dark plain. One interpretation is that this flat dark plain is reworked tephra deposits eroded off of Mount Cleveland volcano and partially building an isthmus between the volcano and the rest of the island. It is labeled Qtr for "reworked tephra".
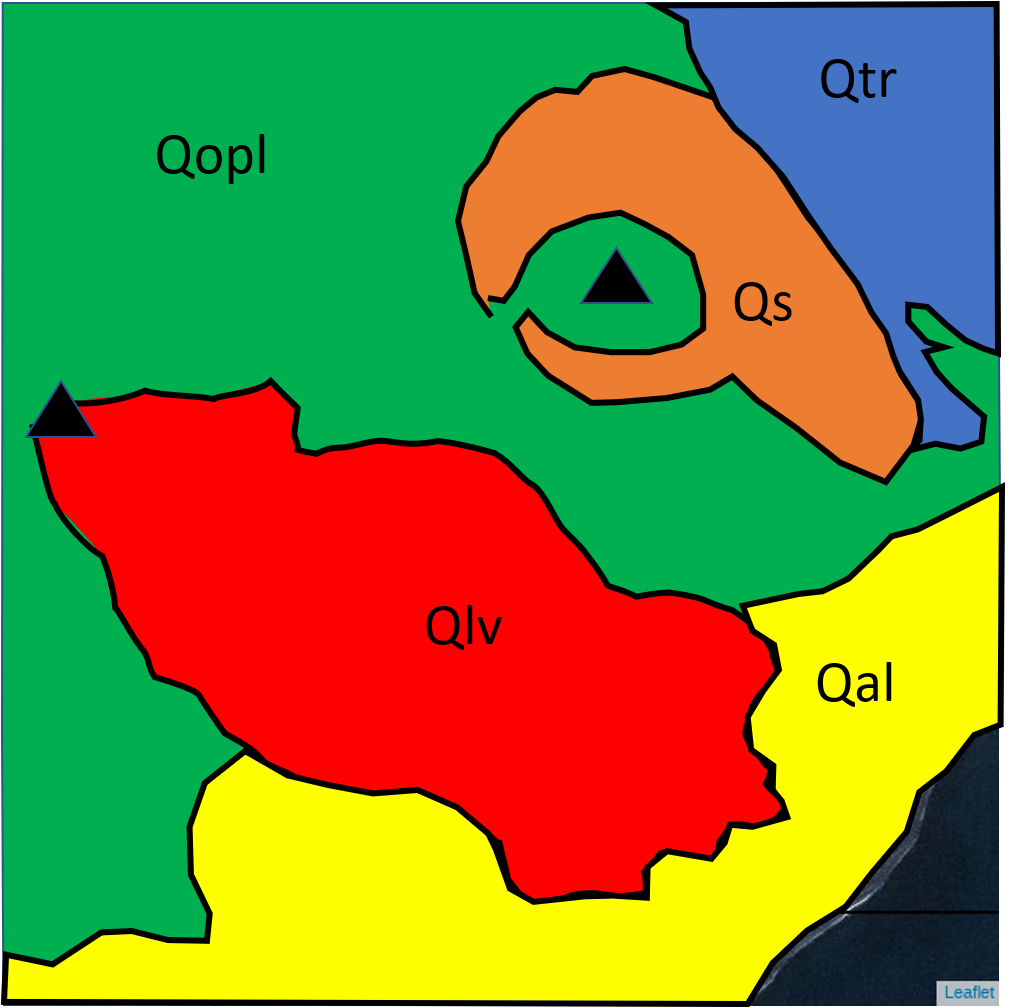
Now we complete the map of this particular image. The entire land surface area of the image is colored and each geologic unit is labeled. The new unit (Qopl, green color) included older rocks upon which the younger lavas, scoria cone and beach deposits have accumulated. These are undifferentiated, older pyroclastic rock (tephra, pyroclastic density current deposits) and older lavas which are mapped as a single unit. Notice that the deposit is vegetated and sometimes buff, tan, or yellow colored.
Triangles are added to show the locations of volcanic vents. One triangle is in the center of the scoria cone crater. Another is located on the lava flow. Study the satellite image and you will see a dome-like feature at the head of the lava flow. This is interpreted to be the location of the volcanic vent that erupted the lava.
Different parts of the volcano have different volcanic features and different geologic units. The following image is of an area on the NE flank of Mount Cleveland volcano. Note the dark gray to brown colors in the SW corner of this image. The smooth areas in this zone are marked by many gullies, just like the scoria cone in the previous example. This is easily eroded pyroclastic deposits and tephra fallout from explosive volcanic eruptions. This unit makes an irregular contact with the older deposits lower on the flank of the volcano.
Some channels low on the flank of the volcano are filled with dark brown and gray material. These are pyroclastic deposits that have been re-mobilized in lahars (debris flows) and transported further down the volcano.
Also note that this image has a change in color trending roughly N-S across the image. This color change is not real, but is a change in the time at which the satellite data were collected. Be careful to evaluate color changes that might be associated with the change in satellite data quality or time of acquisition.
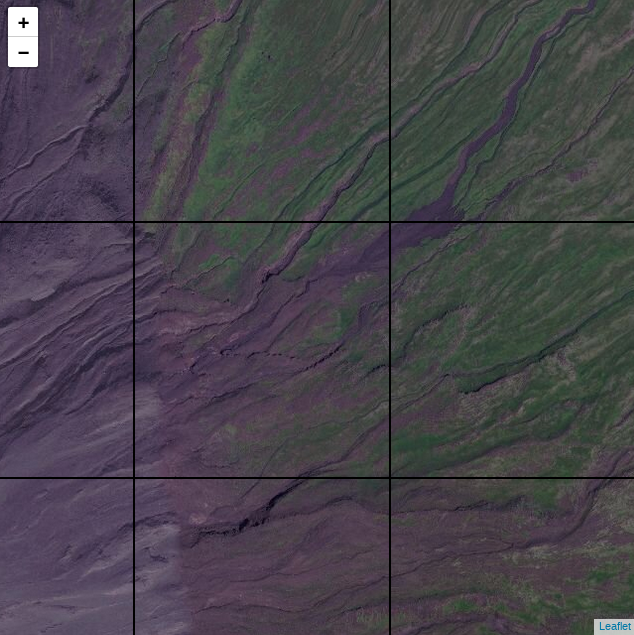
Try to differentiate lava flows and pyroclastic deposits on this image from the N flank of Mount Cleveland volcano.
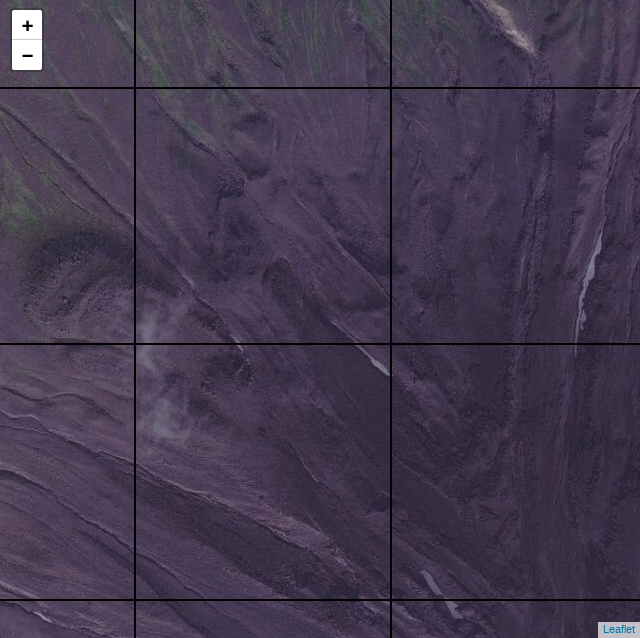
Remotely-sensed data for Mount Cleveland volcano
It helps to try to look at deposits from different perspectives, especially when interpreting the location of geologic units and geologic contacts from remotely-sensed data. The following window shows ESRI satellite data for the region. Zoom in and look around the island!
You can also use Google Earth Pro to investigate the mapping area.
Do the following:
- This satellite image covers a slightly larger area than the example given above, including all of the isthmus. Make a geologic map of this area using the same geologic units and symbols provided in the example.
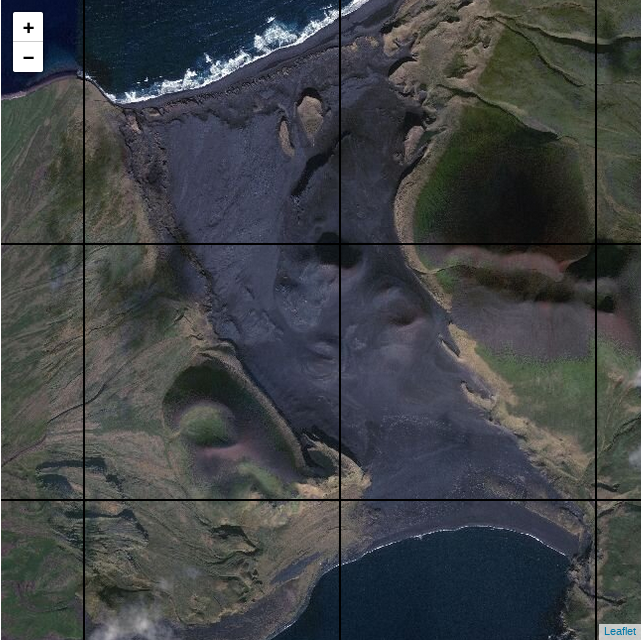
- Download and print the map (you may be provided with a printed copy of the image).
- Outline the geologic contacts and map units
- Write descriptions of the units you identify on the map. Include a legend and symbol key
- Make an approximate scale for the map (e.g., following previous examples or using Goggle Earth Pro).
- Using the digital map in the remotely sensed data section, pan and zoom to observe the geology of all four islands. Use your hand-drawn base map of the four islands to put geologic contacts on your base map. It is not possible to map in the same detail you used in question #1. Instead, show geologic contacts on your base map that show areas of predominantly young pyroclastic deposits (Qp) mostly high on the slopes of the volcanoes), areas that are predominantly lava flows (Qlv), and areas that are predominantly older (Qopl). Add additional units as needed. Color the base map and include a map key (legend).
Turn in your answers to the questions using a word document. Scan your geologic maps and paste into your word document. Or, take a picture of the geologic maps and insert in your word document.