Finding yourself on a topographic map #3. We will learn about converting from Latitude and Longitude to UTM coordinates, map scales, volume calculations and profiles.
Converting from Latitude/Longitude to UTM coordinates
Often map coordinates are provided in latitude and longitude but need to be plotted on a UTM grid. Conversion from latitude and longitude to UTM is not simple. The conversion accounts for the spherical Earth, the departure of the Earth's shape from a perfect sphere, and variation in sea-level, and the Earth's geoid, relative to the center of the Earth. Fortunately there are tools available for doing this conversion. One of the most reliable tools was developed by staff at the US Geological Survey.
This GUI converts latitude and longitude to UTM coordinates and reports the zone, using the Proj.4 Cartographic Projections Library originally developed by USGS Staff scientists and implemented in javascript. Both the latitude and longitude and the UTM coordinates use a WGS84 map datum, which is a map datum widely used in electronic maps, like Leaflet.
Type in different values of latitude and longitude to calculate UTM coordinates. Note that the southern hemisphere has negative latitude and the western hemisphere has negative longitude. (click in the text boxes to change coordinates).
The latitude and longitude of Mt Cleveland volcano are given by the Smithsonian volcano program as 52.825$^{\circ}$ N and 169.944$^{\circ}$ W.
Convert these to UTM and you should get: 571154 E, 5853326 N, UTM zone 2. Note that Mt. Cleveland volcano is in the western hemisphere, so by convention its longitude is negative.
Compare these values with the coordinates of Mount Cleveland volcano on your hand-drawn base map.
One advantage of UTM coordinates is that it is easier to calculate distances in UTM (a Cartesian coordinate system) than using latitude and longitude. This electronic map shows two points (solid red circles) connected by a line across the summit of Mt. Cleveland volcano. You can click on the map and the mouse coordinates will pop up in units of pixels. Zoom in and out! Re-load the page if you get lost.
The coordinates of the endpoints of the line are plotted in latitude and longitude on this map. The coordinates are:(52.852982, -169.906039) and (52.797288, -169.978329). Click anywhere on the map and the screen coordinates (in pixels) will appear in a popup.
Distance formula on a map
Recall that the distance formula is:
$$\textrm{Distance} = \sqrt{(x_1 - x_2)^2 + (y_1 - y_2)^2}$$
where the coordinate of one point is $x_1, y_1$ and the coordinate of the second point is $x_2, y_2$. These coordinates might be expressed as UTM coordinates and represent locations on a map.
$x_1$ might be west or east of $x_2$; $y_1$ might be north or south of $y_2$. The assignment of the two coordinates to ($x_1, y_1$) and ($x_2, y_2$) points does not matter because the distance between the points depends on the squares of the differences in position of the points in the $x$ and $y$ directions. To prove this:
$$(x_1 - x_2)^2 = (x_2 - x_1)^2$$
$$(y_1 - y_2)^2 = (y_2 - y_1)^2$$
so,
$$ \sqrt{(x_1 - x_2)^2 + (y_1 - y_2)^2} = \sqrt{(x_2 - x_1)^2 + (y_2 - y_1)^2} $$
The map distance between the two points can be found by converting the coordinates from latitude / longitude to UTM and then using the distance formula to calculate the distance (meters) between the two points. Recall that UTM coordinates are in units of meters, so the distance will be in meters.
Map scale
Like all maps, this electronic map has a map scale. The map scale changes when you use the mouse to zoom in or out. The length of the line between the solid red dots on the screen changes as the scale changes.
On a paper map, the map scale is dimensionless. A scale of 1:50000 means that one cm on the map equals 50,000 cm (500 m) on the ground. The web browser displays the map using pixels, which like UTM coordinates are a Cartesian coordinate system. For a map displayed in a web browser (or on a computer screen generally) it is convenient to think of the map scale in terms of the ratio of meters to pixels, which has dimensions since a pixel is not equal to a meter.
Usually, on a computer screen the number of pixels in the $x$ direction (horizontal) increases from left to right; the number of pixels in the $y$ direction (vertical) increases from top to bottom. The pixel coordinates of your mouse pointer is given in pixel units on the computer screen (when you click they popup). The image, no matter what the zoom level, is 640 x 640 pixels and pixel (0,0) is in the upper left corner of the map. Just as with using UTM coordinates, the distance between the solid red circles can be calculated in units of pixels using the distance formula.
Because you know the UTM coordinates and the pixel coordinates of the two red solid circles, you can calculate the map scale (meters per pixel). This is a proportion:
$$\textrm{Map scale} = \frac{\textrm{Distance between points (meter)}}{\textrm{Distance between points (pixel)}}$$
Answer these questions
To answer these questions you should develop a spreadsheet using Excel, or for the adventurous you can develop a python script to answer the questions. You will also use your basemap from exercise #2.
Choose a zoom level and solve for the map scale at that zoom level. Report your map scale in units of meters per pixel. What happens to the map scale as you zoom in (increase or decrease?) and out (increase or decrease?)?
Calculate the volume of Mount Cleveland volcano assuming that the volcano is a perfect cone. Recall that the formula for the volume of a cone is:
$$V = \frac{\pi r^2 h}{3}$$
where $r$ is the cone radius and $h$ is the cone height.
Use the distance between the two solid red circles to estimate the radius of Mt Cleveland volcano (meters). Use the elevations reported on the map to find the height of the volcano (contour interval in meters). Click on the map to get the map coordnates in pixels, but do not drag the mouse because that will change the pixel coordinates of specific features.
The oldest rocks that crop out on Mt Cleveland volcano are dacites, thought to be about one million years old. Given this age determination, the entire edifice above sea-level was formed by eruptions during the last one million years. Using these assumptions, what is the average volume erupted per year? This is an estimate of the long term eruption rate of the volcano.
The Smithsonian web-page for Mt. Cleveland volcano reports volcano explosivity index (VEI) for eruptions of the volcano since 1986 (see "eruptive history" on their web-page for Mt. Cleveland. Actually, more data are reported on by the Smithsonian, but only use "confirmed" eruptions (not uncertain eruptions) and only those since January 1, 1986 because these data are most reliable). On the VEI scale, roughly VEI 0 = $1 \times 10^4 \textrm{ m}^3$, VEI 1 = $1 \times 10^5 \textrm{ m}^3$, VEI 2 = $1 \times 10^6 \textrm{ m}^3$, VEI 3 = $1 \times 10^7 \textrm{ m}^3$. Assuming these volumes and using the data in the Smithsonian report of eruptive history, what volume erupted since 1986? How does this rate compare with your long term estimate of eruption rate? Why might these rates be different?
Draw the topographic profile of the volcano along the section between the two solid red circles. To accomplish this:
Zoom to a level at which the profile fills the map area (you can see both red circles and can read the contour line labels every 100 m of elevation). If you have trouble reading the contour interval because of your computer screen resolution, realize that the thick brown contour line are separated by 100 m elevation and the red dots are located at approximately sea-level.
Find the map scale if you have not already done it for the zoom level you choose.
Find the pixel coordinates of every intersection of the 100 m (thick brown) contour lines and the profile.
Calculate the distance of these points along the profile line (you may wish to use a spreadsheet program like Excel). You should make a table of distance along the profile and elevation.
Plot the profile using an appropriate scale and vertical exaggeration on a blank area of your base map. Show the profile line across Mount Cleveland volcano on the base map. Label the ends of the profile A (SW) and A' (NE) on the base map and on your profile section.
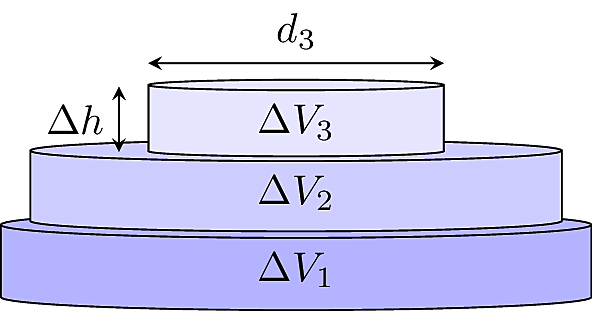
Now estimate the volume of the volcano using your topographic profile instead of the formula for a perfect cone. Notice that you know the diameter of the volcano at discrete elevations (100 masl, 200 masl...1000 masl...1700 m above sea-level). If we assume the topographic profile is representative of any profile we draw across the volcano then:
$$\Delta V = \pi \left [\frac{d}{2} \right ]^2 \Delta h $$
where $d$ is the diameter of the volcano at some height and $\Delta h$ is the height interval represented by that diameter. Notice the the formula is for the area of a circle (m$^2$) multiplied by the thickness (m) of the disk. That is, the formula is for the volume (m$^3$) of a disk. You can measure the diameter of the volcano ($d$) using your topographic profile at each elevation. Disk volumes can be summed to get the total volume of the volcano. Because you can find the diameter of the volcano at 100 m intervals, choose $\Delta h = 100 $ m, estimate $d$ for each elevation, and sum the volumes, $\Delta V$, from sea-level to the top of the volcano.
Estimate the volume as if the volcano is a stack of cylindrical disks. Each disk has thickness $\Delta h$ and diameter $d$, which you determine using your topographic profile by measuring the diameter of the volcano at 100 m intervals of elevation, corresponding to the thick brown contour lines on the map. Sum the volumes of all the disks, $\Delta V_1 + \Delta V_2 + ... + \Delta V_n$, to estimate the volume of the volcano edifice above sea-level, where $n$ is the total number of disks you use.
This calculation is a form of numerical integration. How does the volume calculated using your topographic profile compare with the volume found using the perfect cone formula? How does this change in volume estimate change your estimate of the long-term eruption rate?
Turn in your answers to the questions using a word document. Scan the base map showing the topographic profile and include this in the word document. Or, take a picture of the base map and insert in your word document. Cut and paste the sections of your spreadsheet into the word document, or paste in teh python code you wrote to do the calculations.