Introduction
Geologists and geophysicists make and use maps. These maps must have a common coordinate system. Otherwise, it is very difficult to use information plotted on different maps. In the past, a common coordinate system for most maps was not easy to achieve. During the 1990's, the advent of widely available global positioning system (GPS) receivers made it possible to achieve commonality and cross-referencing among coordinate systems. This common coordinate system vastly improved the quality and usefulness of maps. The downside, if there is one, is that we have to be much more careful about the way we gather and use data that are destined to be displayed on maps.
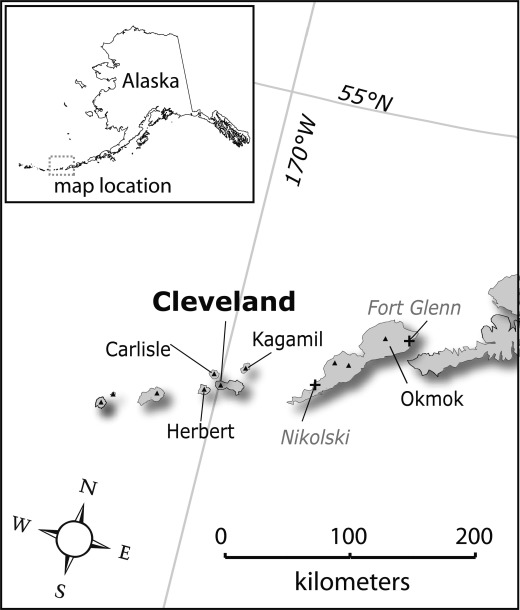
In this exercise, you will learn about Universal Transverse Mercator (UTM) coordinates and about using them. You will use Google Earth Pro to find UTM coordinates, using the area of Mt. Cleveland volcano (AK).
Next, you will use UTM coordinates and bearings to sketch a base map of the four islands around Mt. Cleveland volcano. A base map is a drawing of a geographic location (a study area) that includes enough information to show where other features are on the map. Geologists sketch base maps all the time. For example, a hydrogeology consultant might make a base map showing well locations and prominent features in the well field. A geochemist might make a base map to show the locations of her samples in a report or publication. Field geologists often map geologic contacts and display these on their own base maps. Whether you generate a base map using computer software or by drawing, making a base map is an important skill.
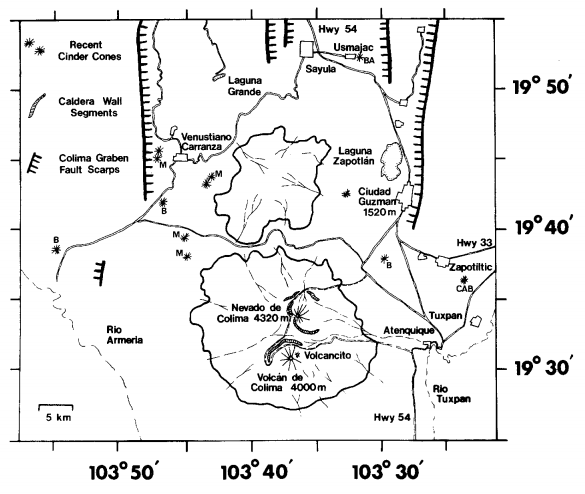
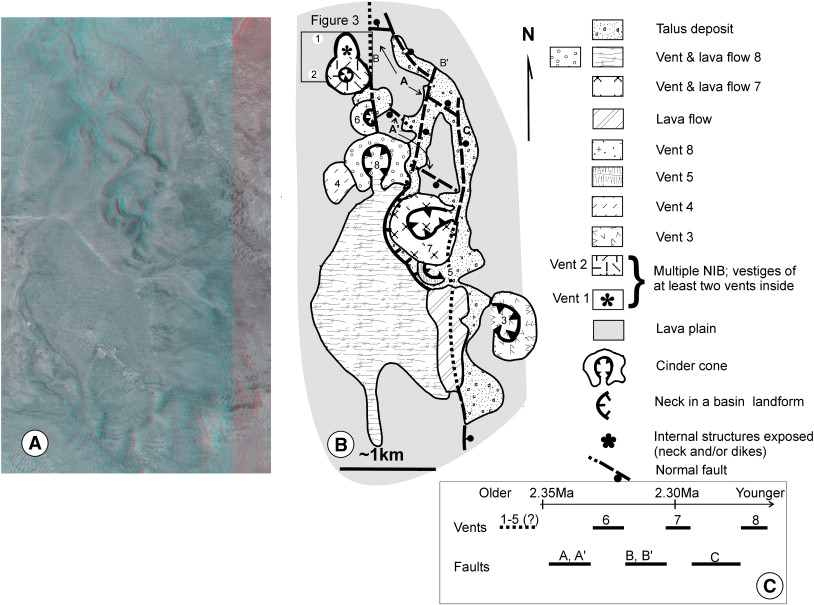
Examples of published base maps
The UTM Grid
Grid systems are widely used by geoscientists to simplify distance calculations on maps. Most maps are Cartesian grids. The $y$-axis is oriented N--S and $y$-coordinates are usually referred to as the Northing, or sometimes as distance north. The $x$-axis is oriented E--W and $x$ coordinates are referred to as the Easting or distance east. Usually the units of these grids are meters.
The Universal Transverse Mercator (UTM) grid is the most important map grid system in use today. In this grid system, the coordinates of a point on the surface of the Earth are given in terms of the Northing coordinate and Easting coordinate. The Northing for the UTM grid in the northern hemisphere is given in meters north of the equator. On a UTM map grid, one can think of the Northing coordinate as the distance North along the $y$-axis of the map. Negative numbers are avoided in the UTM grid. So, in the southern hemisphere, the Northing is given in meters south of the equator (a negative number) + 10,000,000m. For example, the Northing of a point located 2000km north of the equator is 2,000,000N. The Northing of a point located 2000km south of the equator is 8,000,000N. In both the northern and southern hemispheres, UTM Northing is a positive number that increases as one moves north and decreases as one moves south.
The $x$-axis is perpendicular to the $y$-axis at the origin (central meridian) of the coordinate system. Walking East, in a positive $x$-direction on common graphs, increases the value of the Easting coordinate on the UTM grid; walking West decreases the value of the Easting coordinate.
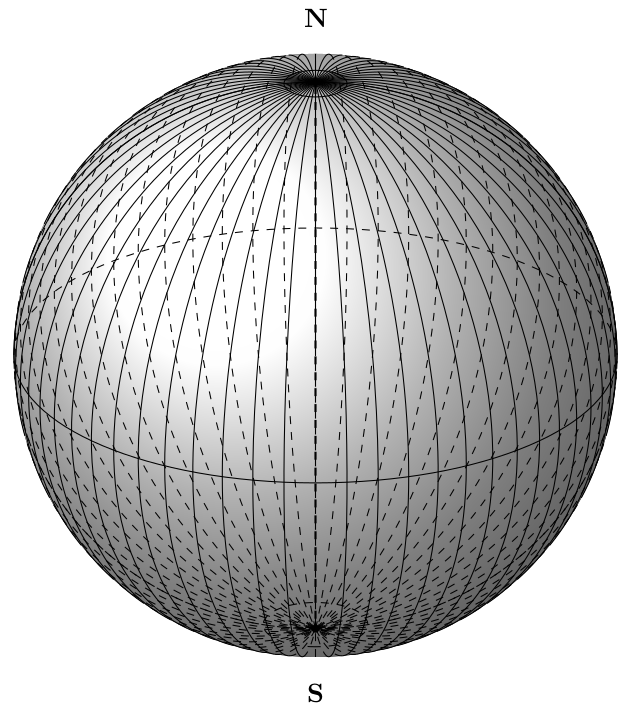
Because the Earth is roughly spherical in shape, it is impossible to describe it with a Cartesian grid without distorting the grid. The UTM grid system breaks up the Earth's surface into 60 zones to minimize this distortion. Each UTM zone has its own central meridian - a line that runs N-S through the center of the zone. Negative numbers are avoided in the UTM grid. Consequently the value of the Easting along the central meridian (the origin of the $x$-axis) of any zone is 500,000E, rather than 0E. West of the central meridian Easting coordinates are less than 500,000E; east of the central Easting coordinates are more than 500,000E. There are enough zones so that, using this scheme, no negative Easting coordinates occur on Earth. The maximum width of each UTM zone at the equator is $<1000$km.
Easting and Northing coordinates in the UTM grid system are not unique. Points in different zones can have the same UTM coordinates because each zone has its own central meridian. Also, points in the southern hemisphere can have the same Northing coordinate as points in the northern hemisphere. In order to fully specify a map location, the Easting, Northing and zone must be reported. These zones are uniquely numbered 1-60. It is also necessary to specify if the coordinate in the zone is in the northern hemisphere (N), or the southern hemisphere (S), although sometimes different designations are used (e.g., U for universal).
For example, the UTM coordinate:
corresponds to a location near Lassen Volcano, California (USA). The UTM coordinate:
corresponds to a location east of the city of Pittsburgh, Pennsylvania (USA). Both points are located approximately 4483km North of the equator. Both points are located approximately 126 km East of the central meridian in their respective zones.
UTM on Mt. Cleveland volcano and environs
Google Earth Pro can report the UTM coordinates of a point on the surface of the Earth. Launch Google Earth Pro and you will see coordinates displayed at the bottom of the screen. These coordinated might be latitude and longitude (probably), or in UTM. To convert the coordinate display to show UTM, do the following steps in Google Earth Pro:
- On the menu bar in Google Earth Pro click Tools then Options...
- On the 3D menu, in the box labeled "Show Lat/Long" select Universal Transverse Mercator
- On the 3D menu, in the box labeled "Units of measure" select meters,kilometers
- click Apply
- click OK
The coordinate display should now show UTM. Navigate to the crater of Mt. Cleveland volcano.
If all goes well, you should see the UTM coordinate of the crater of Mt Cleveland volcano is approximately:- Easting: 570970E
- Northing: 5852900 N
- Zone: 2N
Mt Cleveland is about 5853 km north of the equator and about 71 km east of the central meridian of zone 2.
Answer these questions
Make a word document that contains this work, done using Google Earth Pro + graph paper. You will need pencils, eraser, protractor, ruler and graph paper.
- Find the UTM coordinates of these features near Mt. Cleveland volcano:
- The center of the crater of Herbert volcano
- The summit of Carlisle Island volcano
- Corwin Rock (NE of Chuginadak Island)
- Chuginadak Island has several craters, breached (open) craters and summits. Find the UTM coordinates of at least three of these. Note that some of the crater topography on Chuginadak is complicated and some features might be craters, or might not.
- On GRAPH PAPER, using a pencil, eraser, ruler and protractor, plot a base map of the islands.
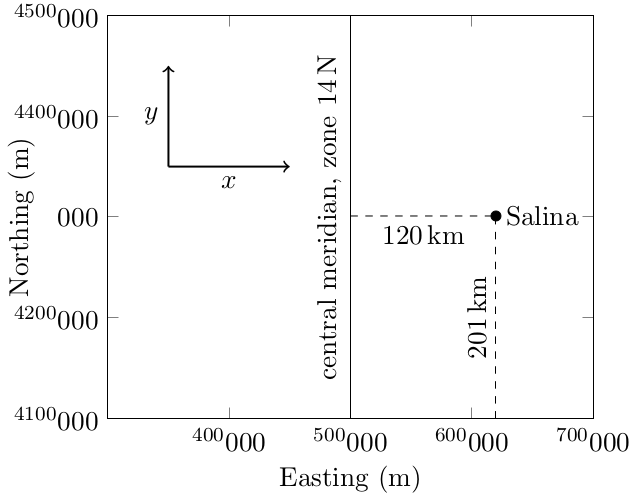
- First, define your scale, labeling UTM coordinates on the margins on the map, as done for the example map of Salina (KS). Make sure your map takes up most of the page and the scale is appropriate to include all four islands (Herbert, Carlisle, Cleveland and Chuginadak, the latter two islands being connected by a small isthmus, actually). Draw the map scale and a north arrow on your map. You want to use the scale as you draw more map features.
- Then plot the UTM coordinates of the features you identified, including the coordinates of the crater of Mt. Cleveland volcano, and label these features on the map.
- Check your map using your map scale. Are the distances between the volcanic features correct? You can use the Google Earth Pro measurement tool to double check the map distances.
- Draw the coastlines of the islands on your map (graph paper). Be sure to include details of the coastlines like bays and peninsulas. Check locations using additional UTM coordinates in Google Earth Pro as you need them. You can use bearings to make sure features like coastlines and craters are lining up correctly on your hand-drawn map. Refer back to the map and azimuth tool you used in the triangulation exercise. Use a ruler and a protractor to measure angles on your map.
- Now add craters - the caldera of Herbert volcano - ridges and other prominent topographic features. These include deep valleys, avalanche chutes and promontories.
- Make sure you include a map legend that explains the symbols you add to your map.
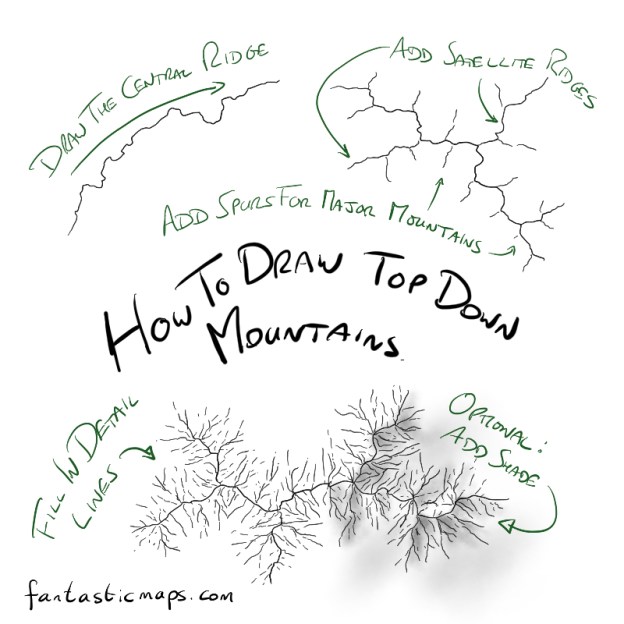
Feel like you cannot draw this topography? Erase a lot! Study the google earth images and draw from the top down. Study the shading in the google earth images - the sun is in the south!
Turn in your graph paper by scanning it (if that is available to you) or take a picture of it and turn this picture in. Make sure the picture or scan is clear. Don't throw away your original map. We will use it in future exercises.